
Happy Groundhog Day! There’s about as much daylight now as there was around Thanksgiving, (about 5 weeks before the solstice), which means we have made it through the 10 darkest weeks of the year. Also a giant ground rat saw his shadow, which means it’s either six more weeks of a winter or there’s a time loop afoot. It’s a quintessentially American holiday.
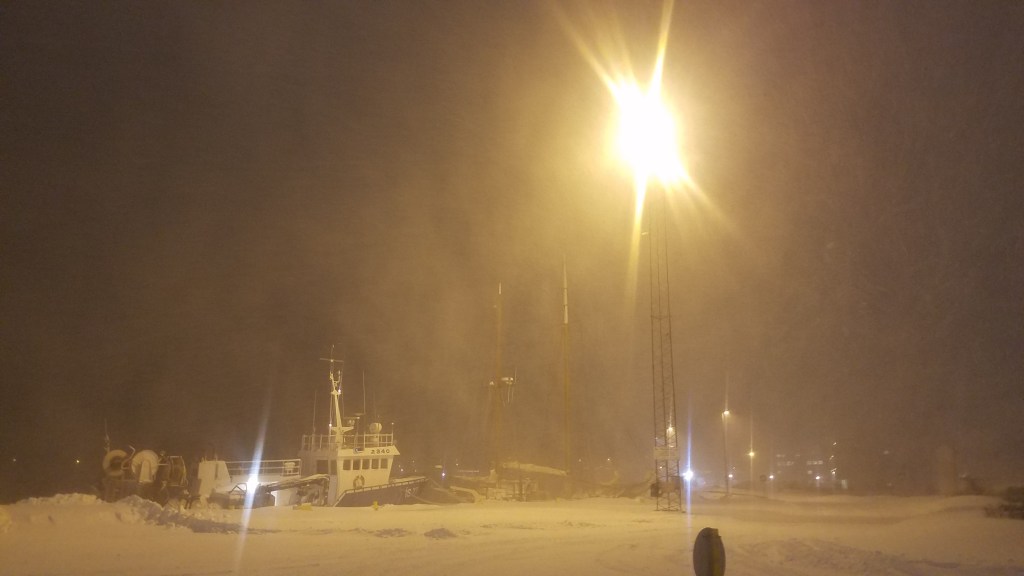
I went out last night to try and see the green comet which is supposed to be visible for the next few weeks as it travels between the Ursas and towards Perseus. It’s right on the edge of naked eye visibility as a faint green smear, if the weather is good. The weather, alas, has not been good. Howling winds, total cloud cover, snow, the works. It was calmer last night, but still very cloudy so I didn’t see it, but I did snag a pretty good picture of the moon.

One kind of wild thing about winter here is how windy it is; there have been several more days with gale warnings since last week, which makes going to school (usually upwind) exciting. I kinda vaguely want to tack upwind, but there’s cars on the road. It has been so windy that although it has snowed a significant amount (winter at nearly the 66th parallel is snowy. wild, huh) that we haven’t really had to shovel the front walk because the wind keeps clearing it off instead. Of course, sometimes it just kicks the snow into the air and everything goes sideways.
I’m still having fun with the GIS class; one of the problems I had the last time was I couldn’t figure out how to save all of layers in a way that they would actually open correctly again. So I did every project in a several hour adrenaline filled sprint, praying that the program didn’t crash. Turns out it’s more fun when you can save things and stand up in the middle. I have made a lot of maps recently, but they all combine being quite ugly with difficult to build, as they are more like problem sets than they are like proper cartography, so I’m less inclined to show them off than I might be. And the final project is currently in the larval stage where it hardly looks like anything at all because I’m trying to take all my vector data and turn it into raster data, and my laptop is running only a little slowly about it. I often get whiplash when I talk to computer people about time because they say things like, ”Oh it’s running so slowly, it’s taking milliseconds,” and when you ask very patiently how long it could be taking they say something like nanoseconds, which is a completely foolish unit of time. I grant you, geologists tend towards any process that happens on a thousand year timescale is roaring right along, but human reaction time is around 250 milliseconds, or about a quarter of a second, so I think it’s fine. My eight year old laptop can take 2 and a bit minutes to do a big raster calculation. That happens sometimes.
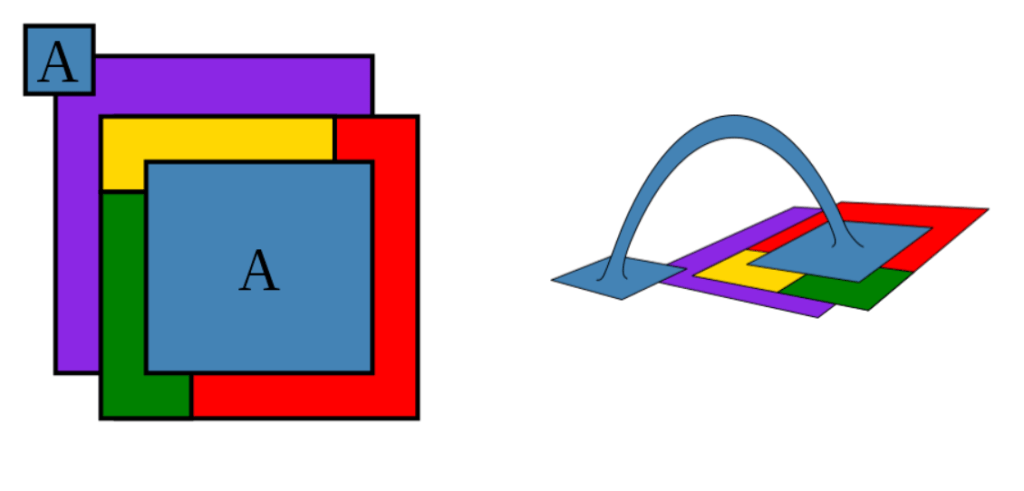
We were talking about how many colors you need to color a map a few days ago, and I was cheerfully anticipating talking about the four color map theorem, but the professor said you need five colors to color a political map so that no countries that border each other share a color. Which prompted me to do a little googling, and it turns out there is a wrinkle of a difference between graph theory maps and political maps, which is overseas territories. If you’re just tiling a plane with shapes, you only need four colors so no adjacent shapes have the same color. However, real-world countries have overseas territories, which means if you want territories to have the same color as the parent country, all the math changes, and you do in fact need five colors. I also found my new favorite picture from Wikipedia depicting this:
I also caught the edge of a pretty good sunset out out my skylight a couple days ago:


Leave a comment